
Perfect Sense AQ: Improving the Air Around Us With Pin Badge Innovation

Imagine a connected world where all students can make the healthiest route choices as they walk to school. That would make perfect sense and is an idea that I have built on with this original question:
"It should be healthier to walk to school than go in the car, right?"

Figure 1: Air pollution statistics. Figure created by author, using data from University Medical Centre Mainz (2019).
As a response to global problems, particularly the UN’s thirteenth Sustainable Development Goal on Climate Action, my ambition was to develop a portable air quality sensing device that I could build myself whilst learning something about science, data and programming along the way [1][2]. This would also give friends equal chances to learn how mankind can be empowered to make healthier decisions based on personalised data.
From talking to peers, I realised that they and I were unable to use real-time air quality data to make healthy route decisions on the way to school like scientists do. We could download an app or buy a device to measure the amount of pollution, but it would not accurately reflect the air around us at that moment. This further motivated me to build an air quality sensor as a wearable device.
My first prototype tracked location, measured air quality and could be worn on a bag or school blazer by teenagers. This meant that the sensor was both fashionable and functional, giving us information when we walked into pollution hotspots and healthier areas and guiding us to make decisions from our own data collection.
Tracking location data with GPS, alongside particulate matter 2.5 and 10 readings, enabled us to change our walking habits to and from school. Air quality data for areas near roadside standings also helped us ensure that we were choosing the cleanest routes possible.
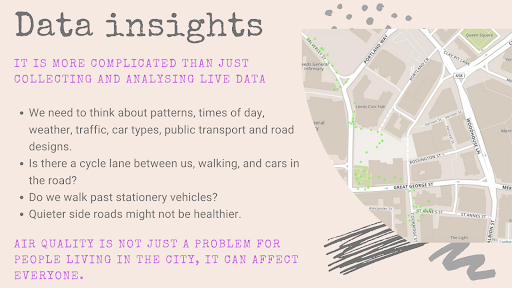
Figure 2: Summary of insights gained from air quality data in phase 1 of the project. Figure created by author.
Taking an example hypothesis about main roads versus side streets, we realised that the science of pollution and air quality was more complicated than we initially thought. We noted that cars taking shortcuts down side streets and then queuing at the end of them to join the main road could cause more pollution as they waited. Also, we realised that we needed to take weather conditions and other variables into account since they had an effect on the obtained readings. An example is that of rainfall, which lowers the levels of pollution meaning that data collected on rainy days may initially appear as an anomaly. Patterns became an important part of building up a picture of the air quality in our local area.
Last year, I took the opportunity to work with nano-scientists at Graphene@Manchester, and we are currently developing a pin-badge that collects air quality data. Refining the project using innovative science and materials is an exciting phase for this next iteration, as we reduce the overall size of the wearable pin-badge without compromising its ability to function. The first design was too bulky to wear on clothing, whereas the retro style pin-badge that we are working on is more versatile and efficient than my first prototype.

Figure 3: Concept image created in collaboration with @burritoesart
I am confident that giving young people the chance to understand their environment and explore wider areas of sustainable goals by creating their own projects and collecting their own data will help us all to improve our futures.
References
[1] Lelieveld et al., (2019) Cardiovascular disease burden from ambient air pollution in Europe reassessed using novel hazard ratio functions. European Heart Journal.
[2] “Sustainable Development Goals .:. Sustainable Development Knowledge Platform,” United Nations. [Online]. Available: https://sustainabledevelopment.un.org/?menu=1300. [Accessed: 07-Jun-2020].